originally published by The Chronicle of Higher Education as “How to Stop Academic Fraudsters” (I didn’t choose that title)
“Hi Alex, this is not credible.”
I’ll never forget that email. It was 2016, and I had been helping psychology researchers design studies that, I hoped, would replicate important and previously published findings. As part of a replication-study initiative that I and the other editors had set up at the journal Perspectives on Psychological Science, dozens of labs around the world would collect new data to provide a much larger dataset than that of the original studies.
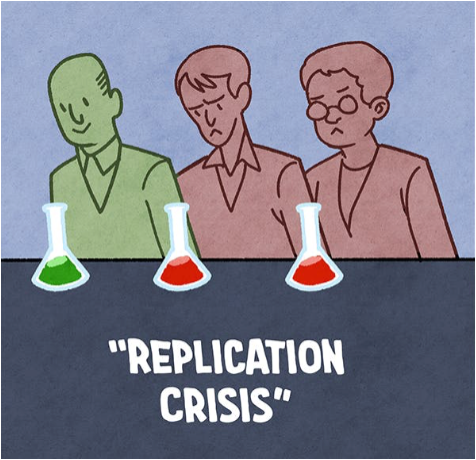
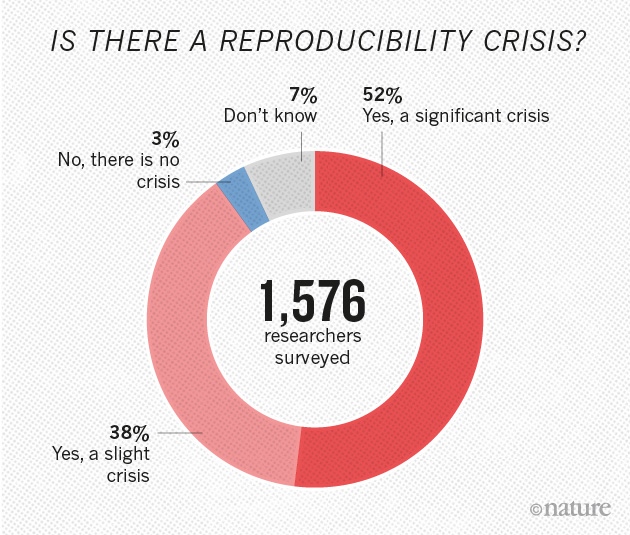
With the replication crisis in full swing, we knew that data dredging and other inappropriate research practices meant that some of the original studies were unlikely to replicate. But we also thought our wide-scale replication effort would confirm some important findings. Upon receiving the “this is not credible” message, however, I began to be haunted by another possibility — that at least one of those landmark studies was a fraud.
The study in question was reminiscent of many published in high-impact journals in the mid-2010s. It indicated that people’s mood or behavior could be shifted a surprising amount by a subtle manipulation. The study had found that people became happier when they described a previous positive experience in a verb tense suggesting an ongoing experience — rather than one set firmly in the past. Unfortunately for psychology’s reputation, social-priming studies like that had been falling like a house of cards, and our replication failed, too. In response, the researchers behind the original study submitted a new experiment that appeared to shore up their original findings. With their commentary, the researchers provided the raw data for the new study, which was unusual at the time, but it was our policy to require it. This was critical to what happened next.
One scholar involved in the replication attempt had a close look at the Excel spreadsheet containing the new data. The spreadsheet had nearly 200 rows, one for each person who had supposedly participated in the experiment. But the responses of around 70 of them appeared to be exact duplicates of other people in the dataset. When the duplicates were removed, the main result was no longer statistically significant.
After thanking the scholar who had caught the problem, I pointed out the data duplication to the researchers behind the original study. They apologized for what they described as an innocent data-processing mistake. Then, rather conveniently, they discovered some additional data they said they had accidentally omitted. With that data added in, the result was statistically significant again. By this point, the scholar who had caught the duplication had had enough. The new data, and possibly the old, were no longer credible.
I conducted my own investigation of the Excel data. I confirmed the irregularities and found even more inconsistencies when I examined the raw data exactly as downloaded from the online service used to run the study. The other journal editors and I still didn’t believe that the reason for the irregularities was fraud — all along, the researchers behind the original study had seemed very nice and were very obliging about our data requests — but we decided that we shouldn’t publish the commentary that accompanied the questionable new data. We also reported them to their university’s research-integrity office. After an investigation, the university found that the data associated with the original study had been altered in strategic ways by a graduate student who had also produced the data for the new study. The case was closed, and the paper was retracted, but the cost had been substantial, involving thousands of hours of work by dozens of people involved in the replication, the university investigators, and at least one harried journal editor (me).
More recently, two high-profile psychology researchers, Francesca Gino of Harvard and Dan Ariely of Duke, faced questions about their published findings. The data in Excel files they have provided show patterns that seem unlikely to have occurred without inappropriate manipulation of the numbers. Indeed, one of Ariely’s Excel files contains signs of the sort of data duplication that occurred with the project I handled back in 2016.
Ariely and Gino both maintain that they never engaged in any research misconduct. They have suggested that unidentified others among their collaborators are at fault. Well, wouldn’t it be nice, for them and for all of us, if they could prove their innocence? For now, a cloud of suspicion hangs over both them and their co-authors. As the news has spread and the questions have remained unresolved, the cloud has grown to encompass other papers that Ariely and Gino were involved in, for which clear data records have not yet been produced. Perhaps as much to defend their own reputations as to clean up the scientific record, Gino’s collaborators have launched a project to forensically examine more than 100 of the papers that she has co-authored. This vast reallocation of academic expertise and university resources could, in a better system, be avoided.
How? Researchers need a record-keeping system that indicates who did what and when. I have been using Git to do this for more than a decade. The standard tool of professional software developers, Git allows me to manage my psychology-experiment code, analysis code, and data, and provides a complete digital paper trail. When I run an experiment, the data are recorded with information about the date, time, and host computer. The lines of code I write in R to do my analysis are also logged. An associated website, GitHub, stores all of those records and allows anyone to see them. If someone else in my lab contributes data or analysis, they and their contributions are also logged. Sometimes I even write up the resulting paper through this system, embedding analysis code within it, with every data point and statistic in the final manuscript traceable back to its origin.
My system is not 100 percent secure, but it does make research misconduct much more difficult. Deleting inconvenient data points would be detectable. Moreover, if trusted timestamping is used, the log of file changes is practically unimpeachable. Git is not easy to learn, but the basic concept of “version history” is today part of Microsoft Word, Google Docs, and other popular software and systems. Colleges and universities should ensure that whatever software their researchers use keep good records of what the researchers do with their files.
While enabling more recording of version history would be only a small step, it could go a long way. The Excel files that Gino and Ariely have provided have little to no embedded records indicating what changes were made and when. That’s not surprising — their Excel files were created years ago, before Excel could record a version history. Even today, however, with its default setting, Excel deletes from its record any changes older than 30 days. Higher-ed institutions should set their enterprise Excel installations to never delete their version histories. This should also be done for other software that researchers commonly use.
Forensic data sleuthing has found that a worrying number of papers published today contain major errors, if not outright fraud. When the anesthesiologist John Carlisle scrutinized work submitted to the journal he edited, Anaesthesia, he found that of 526 submitted trials, 73 (14 percent) had what seemed to be false data, and 43 (8 percent) were so flawed they would probably be retracted if their data flaws became public (he termed these “zombie” trials). Carlisle’s findings suggest that the literature in some fields is rapidly becoming littered with erroneous and even falsified results. Fortunately, the same record-keeping that allows one to conduct an audit in cases of fraud can also help colleges, universities, journals, and researchers prevent errors in the first place.
Errors will always occur, but they are less likely to cause long-lasting damage if someone can check for them, whether that’s a conscientious member of the research team, a reviewer, or another researcher interested in the published paper. To better check the chain of calculations associated with a scientific claim, more researchers should be writing their articles in a system that can embed code, so that the calculations behind each statistic and point on a plot can be checked. These are sometimes called “executable articles” because pressing a button executes code that can use the original data to regenerate the statistics and figures.
Scholars don’t need to develop such systems from scratch. A number of services have sprung up to help those of us who are not seasoned programmers. A cloud service called Code Ocean facilitates the creation of executable papers, preserving the software environment originally used so that the code still executes years later. Websites called Overleaf and Authorea help researchers create such documents collaboratively rather than leaving it all on one researcher’s computer. The biology journal eLife has used a technology called Stencila to permit researchers to write executable papers with live code, allowing a paper’s readers to adjust the parameters of an analysis or simulation and see how that changes its results.
Universities and colleges, in contrast, have generally done very little to address fraud and errors. When I was a Ph.D. student in psychology at Harvard, there were two professors on the faculty who were later accused of fraud. One of them owned up to the fraud and helped get her work retracted. The other, Marc Hauser, “lawyered up” and fought the accusations, but nevertheless he was found by Harvard to have committed scientific misconduct (the U.S. Office of Research Integrity also found him to have fabricated data).
As a result, Harvard had more than a decade after the findings of serious fraud by two of its faculty members to prepare for, and try to prevent, future misconduct. When news of the Gino scandal broke, I was shocked to learn how little Harvard seemed to have improved its policies. Indeed, Harvard scrambled to rewrite its misconduct policies in the wake of the new allegations, opening up the university to accusations of unfair process, and to Gino’s $25-million lawsuit.
The problems go well beyond Harvard or Duke or even the field of psychology. Not long after John Carlisle reported his alarming findings from clinical-trial datasets in anesthesiology, a longtime editor of the prestigious BMJ (formerly the British Medical Journal) suggested that it was time to assume health research is fraudulent until proven otherwise. Today, a number of signs suggest that the problems have only worsened.
Marc Tessier-Lavigne is a prominent neuroscientist and was, until recently, president of Stanford University. He had to resign after evidence emerged of “apparent manipulation of research data by others” in several papers that came from his lab — but not until after many months of dogged reporting by the Stanford student newspaper. Elsewhere in the Golden State, the University of Southern California is investigating the star neuroscientist Berislav Zlokovic over accusations of doctored data in dozens of papers, some of which led to drug trials in progress.
In biology labs like those of Tessier-Lavigne and Zlokovic, the data associated with a scientific paper often include not only numbers but also images from gel electrophoresis or microscopy. An end-to-end chain of certified data provenance there presents a greater challenge than in psychology, where everything involved in an experiment may be in the domain of software. To chronicle a study, laboratory machines and microscopes need to record data in a usable, timestamped format, and must be linked into an easy-to-follow laboratory notebook.
If we want science to be something that society can still trust, we must embrace good data management. The $25 million that Harvard could lose to Gino — while a mere drop in the operating budget — would go far if spent on developing good data-management systems and training researchers in their use. The reputational returns to Harvard, to its scholars, and to academic science in general would repay the investment many times over. It’s time to stop pretending academic fraud isn’t a problem, and to do something about it.